
“Researchers must read papers for several reasons: to review them for a conference or a class, to keep current in their field, or for a literature survey of a new field. A typical researcher will likely spend hundreds of hours every year reading papers.
Learning to efficiently read a paper is a critical but rarely taught skill. Beginning graduate students, therefore, must learn on their own using trial and error. Students waste much effort in the process and are frequently driven to frustration.”
To make reading easier, Keshav suggests three passes: get an overview, understand the evidence, then check the details. Each pass answers a different question. You can stop when you have enough information for your purpose.
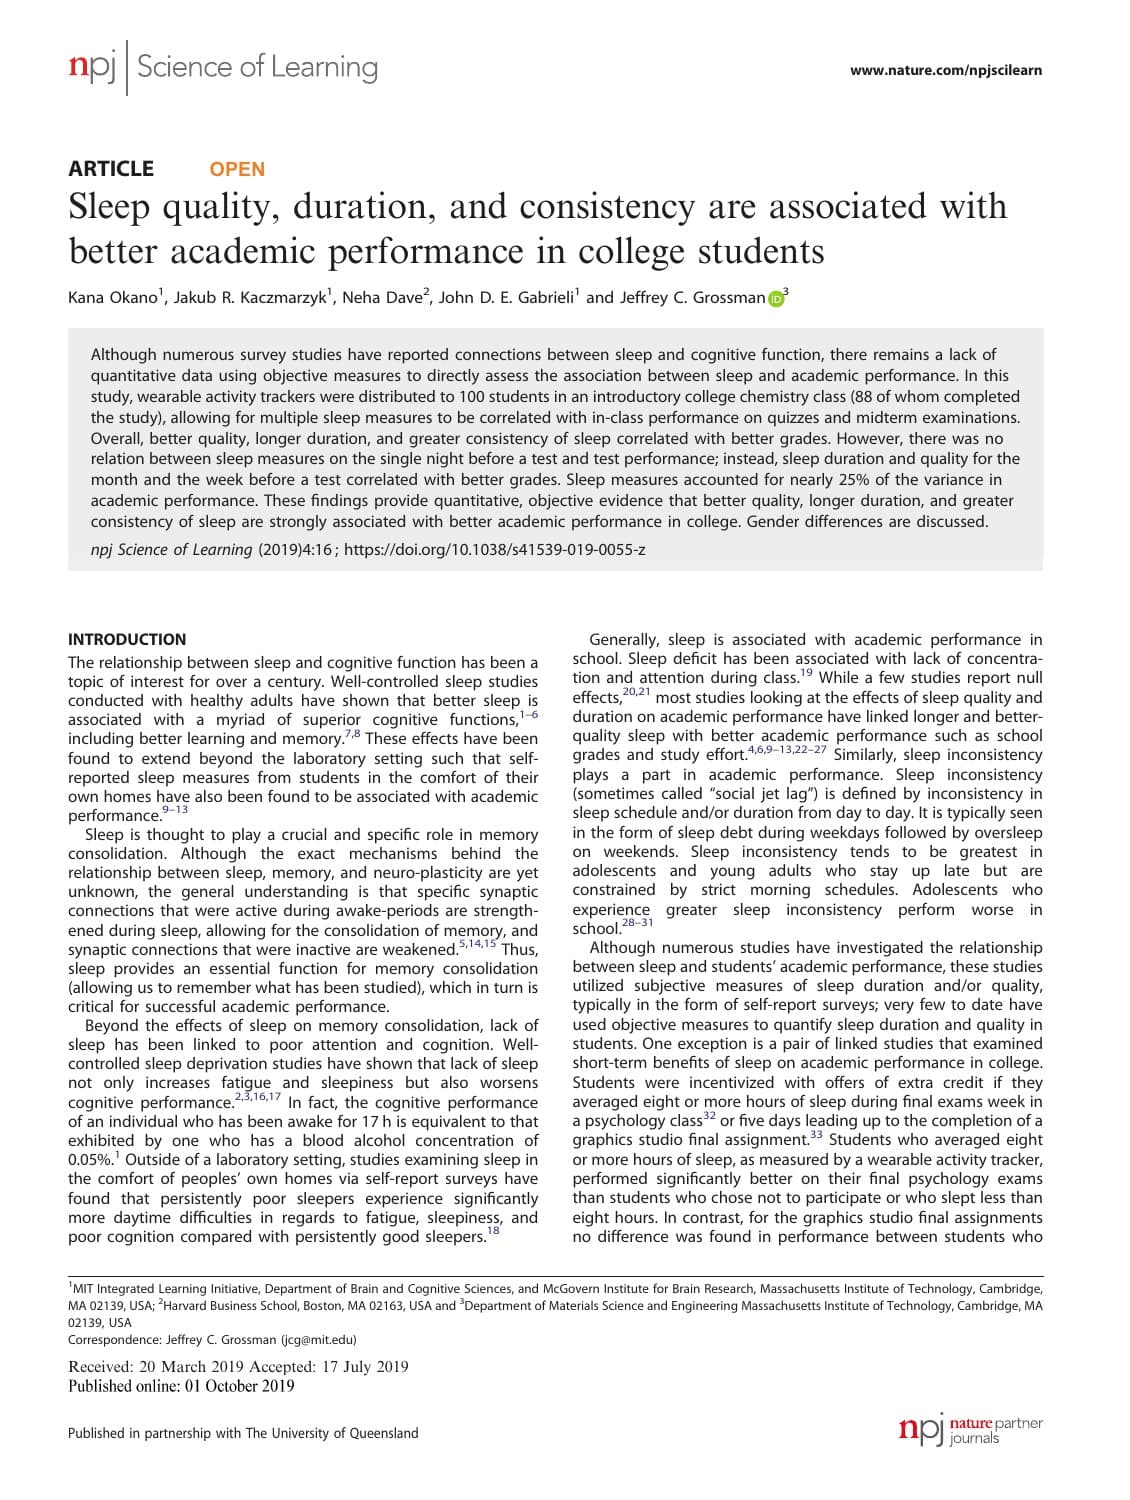
To see how this works, we will follow a real study of sleep and academic performance. We will start with its title, read one chart, and decide what we can learn from it. The examples below focus on studies that collect or analyze data; other kinds of papers may need a different approach.
Step 1: Choose a question or goal
First, write down what you want to learn from the paper. You might need an example for class, evidence for an idea, or a method for your own project. This gives you a reason to focus on some details and leave others for later.
A broad topic can be hard to follow, so turn it into a specific question. In her guide to reading scientific papers, Halimat Chisom describes starting this way. Instead of stopping at “I want to learn about sleep,” ask what you want the study to help you understand.
For example, our question is: What does this study show about consistent sleep and academic performance? To answer it, we need to find out how the researchers measured sleep consistency and how they compared it with students’ scores.
Keep that question at the top of your notes as you read. If the paper turns out to answer a different question, you can move on. If it answers only part of yours, note which part and what you still need to find.
Step 2: Get an overview
With your question in mind, check whether the paper is worth a closer read. In Keshav’s three-pass approach, this first pass takes about five to ten minutes. Read the title, abstract, introduction, and conclusion. Then scan the headings and references to see what the paper covers.
For the sleep study, the title gives us our first clue: sleep measures “are associated with” academic performance. This says the two are related. Explore the title below to see what it tells us to check next.
What do these words measure?
Sleep quality, duration, consistency, and academic performance each need a definition. Look for how the authors measured them as you read.
Know where to look next
After the title, use the section headings to find the details you need. Each section has a different job:
- Abstract
- What is the study about, and what does it report finding?
- Introduction
- Why did the authors ask this question? What was missing from earlier work?
- Methods
- Who or what was studied, and how were the measurements and comparisons made?
- Results
- What did the measurements show? Which figures or tables support the finding?
- Discussion
- How do the authors explain the result, and what limits do they acknowledge?
- References
- Where can you check the earlier work a statement depends on?
These sections do not always appear in the same order. In our example, the Methods start on page 4, after the Discussion. So when we need to know who took part, we can go straight to page 4.
Leave room for things you do not understand yet
As you skim, you will probably meet unfamiliar words or ideas. Haya Elamir’s Princeton guide reminds readers that this is normal. If you lose track of the main idea, return to the abstract. Look up terms that help with your question, and leave the rest for later.
To keep moving, turn a confusing passage into a short question in your notes. For example, “How did they measure consistency?” gives you something clear to look for on the next pass.
By the end of this pass, try describing the study in one sentence: “The researchers tracked students’ sleep during a course and compared it with their test scores.” With that outline, we can now check how they did it.
Step 3: Understand the evidence
Now move from what the paper says to the evidence behind it. Keshav’s second pass focuses on understanding the argument, reading the figures, and noting what needs more work. For our question, we will check the measurements first, then read the chart.
Find out what was measured
Start with the words used in the claim. “Quality” and “performance” can mean many things. To understand this study, we need to know exactly what the researchers measured.
For that, open the Methods in Okano and colleagues’ paper. The study began with 100 volunteers from one MIT chemistry course; 88 completed it. The researchers used Fitbit devices to track sleep and compared those records with students’ scores.
More specifically, “academic performance” means a combined score from eight quizzes and three midterms. The final exam is not included. So when we describe the result, we should say “scores in this course” rather than make a claim about all academic success.
Next, check what “consistency” means. The Results use a measure called standard deviation to describe how much each student’s hours of sleep changed from night to night. A lower value means more consistent sleep duration.
For example, sleeping seven hours each night is more consistent than switching between five and nine hours, even though the average is the same. That is why we need to keep sleep duration and its consistency separate when we read the chart.
Use the same check in your own paper: who or what was studied, what was measured, and what was compared? If a technical term keeps you from answering, look it up now. You know what you need it for.
For example: reading a chart from the sleep study
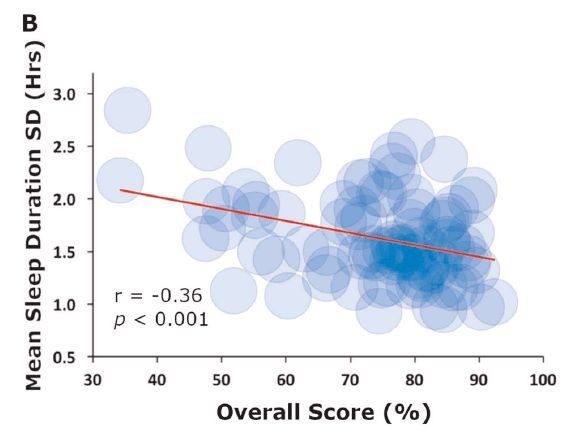
Look at Figure 1B on page 2. Start with the caption and axis labels. Each dot represents one student.
Scores go up from left to right. The vertical axis shows how much a student’s sleep hours changed between nights, measured in hours. A lower dot means more consistent sleep.
The red line slopes down: students with more consistent sleep tended to score higher. This was not true for everyone. Try the demo below to see the trend and how individual students differed.
Lower means more consistent.
The horizontal axis shows course scores. The vertical axis shows how much nightly sleep duration varied, measured in hours. A lower value means less variation.
In this group, students with more consistent sleep tended to have higher course scores.
When reading this chart, remember that the vertical axis shows variation in sleep, not total hours slept. A lower point means more consistent sleep, not less sleep.
Step 4: Check how the study was done
Now check whether the way the study was done supports its conclusion. This helps you decide how much to rely on the finding and whether it applies to your question.
Open the Methods section and try to explain the main steps in your own words. This is part of Keshav’s approach to a closer reading. Use these four questions:
- Who or what was studied?
Find out how the people or data were selected, how many were included, and who was left out. This tells you which people or situations the result may apply to.
- How was it measured?
Look for the exact definition and the tool used. Does the measurement capture what the authors claim? For example, a test score measures something different from a student’s own rating of how well they learn.
- Was the comparison fair?
Identify what was compared. If there were groups, check how people were assigned and whether the groups differed in other ways. Those differences could help explain the result.
- What could affect the result?
Check the Methods and Discussion for missing data, excluded participants, or limits of the tools. Ask whether these could change the answer to your question.
Does the conclusion match the study?
Read the conclusion again with your answers in mind. Does it go beyond the people, measurements, or comparisons the study actually covered? Remember: a link between two things does not, by itself, show that one causes the other.
For example, the sleep study tracked existing sleep habits; it did not test whether changing those habits improved grades. That means it can show a link, but it cannot tell a student that changing their sleep will raise their score.
If an important detail is unclear, check the extra materials linked to the paper. If you still cannot find it, write down what is missing and why it matters. You do not need to settle every question before moving on.
Step 5: Compare related papers
If the paper leaves part of your question unanswered, look for a few related studies. Start with its references, or find a review article on the same topic. Other studies may cover people, methods, or situations that this paper did not.
For each paper, note who or what was studied, how it was measured, and what the researchers found. Compare these details before combining the conclusions. If two papers disagree, check whether they studied different groups or measured different things.
Keep track of where the findings agree and what is still unclear. Once you have enough information for your question, use these notes to put together your answer.
Step 6: Write a useful reading note
Whether you read one paper or several, return to the question you started with. Close the papers and answer it in your own words. If part of your answer is hard to explain, go back to the relevant section and check it.
Save your answer in a short note with the finding, its limits, and where to check the evidence. For example, here is a note on the sleep study:
What does this study show about consistent sleep and academic performance?
- What the researchers did
- Compared wearable sleep measurements with course scores for 88 students in one MIT chemistry course.
- What I learned
- Students whose nightly sleep duration varied less tended to have higher scores across eight quizzes and three midterms.
- What remains open
- Whether changing sleep consistency would change scores. The researchers did not test a change to students’ sleep.
If you compared several papers, keep a note like this for each one. Then add a short summary of where they agree or differ, with links to the papers. This makes it easier to check which study supports each part of your answer.
The next time you return to this question, your notes will show what you learned, where to find the evidence, and what you still need to check.
Sources & further reading
The three-pass framework comes from S. Keshav. The sleep-study walkthrough, interactive annotations, and reading-note example were developed for this article. The other guides offer complementary reading advice.
- How to Read a PaperS. Keshav · University of Waterloo · PDF hosted by Stanford
- A Guide to Reading Research Papers Like A ProHaya Elamir · Princeton Correspondents on Undergraduate Research · 2025
- How I Read Science Research Papers and Journal Articles without Dying of ConfusionHalimat Chisom · Medium · 2023
- Sleep quality, duration, and consistency are associated with better academic performance in college studentsOkano et al. · npj Science of Learning · 2019